Tricia Apel
National Board Certified
Middle School Math Teacher
National Board Certified
Middle School Math Teacher
 |
Students use postive and negative manipulatives (made from tile spacers) to gain a concrete understanding of the relationship between adding, subtracting, negative and positive integers. |
 |
In a multidisciplanary science/math humanities/art lesson, students draw an endangered animal and create a graph from their illustration. They perform a mathematical expansion on the points in their graph, then graph the larger image on poster-sized graph paper. |
 |
Students measure the weight of a series of fruits in a science-math integrated lab experiment. They graph the relationship between the weight of the peel to the weight of the whole fruit and look for correlations. |
 |
In an integrated lesson with math and physical education class, students explore geometric concepts through dance. These students are acting out the concept of complementary angles. |
 |
These students are showing supplementary angles; making a kinesthetic connection to gain a deeper understanding of angles that add up to 180 degrees. |
 |
Students in collaborative groups use DyKnow software on the tablet PCs to work together on each other's screens. This group of four was working together to solve a complex two-step equation. |
 |
Students form a giant human histogram demonstrating the range of name lengths in our class. Then they turn the histogram into a box-and-whisker graph. Statistics, graphing, and measures of central tendency all become more meaningful when groups of students collaborate together to visualize the data. |
 |
Students use linker cubes to represent the length of their name. They are able to model a histogram with their cubes as the first part of this activity. |
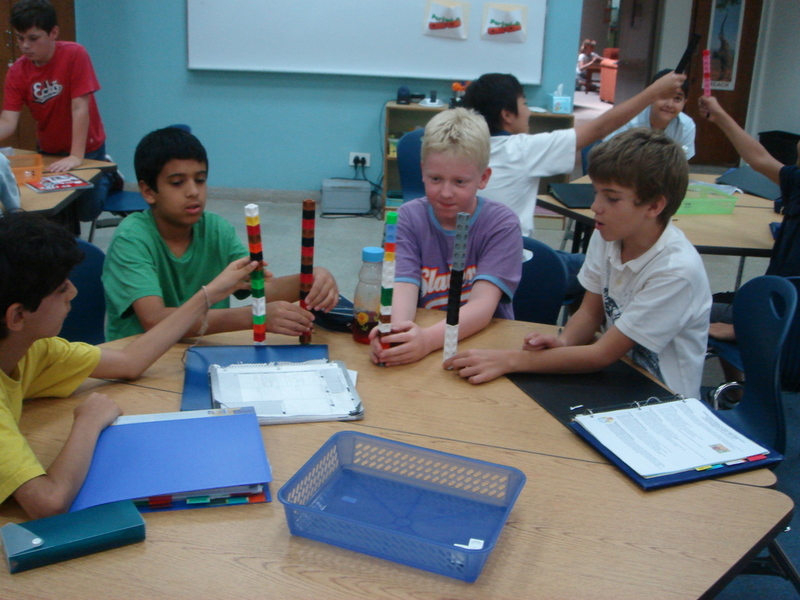 |
Then they calculate the average at their table by "evening out" the collection of cubes. This is a hands-on way to gain a deeper understanding of mean or average, which are often complex concepts for sixth graders. |
 |
This student uses Geometer's Sketchpad on the tablet PC to explore the relationships between angles. He is creating his own understanding of complementary, supplementary and vertical angles. Through investigation, he will derive his own definition of the relationship between these complex concepts. |
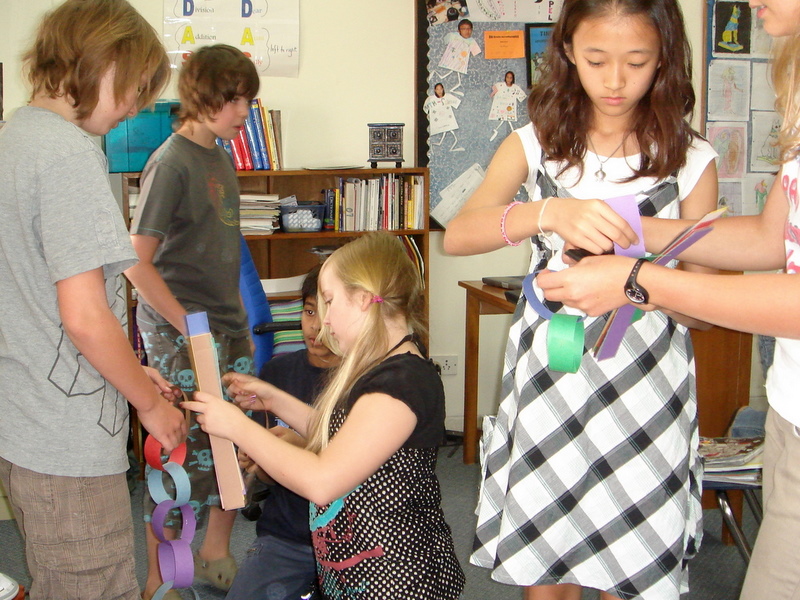 |
For Pi Day (March 14), students created a construction-paper chain where each color-coded loop of paper represented one digit. The result filled the hallway with nearly one thousand digits! |
 |
In a unit on probability, students "sample the planet" by tossing an inflatable globe to measure the relative amounts of land and ocean. They learn that the larger their sample size, the closer the sample gets to reality. |
 |
A student uses the SmartBoard to explore the concept of average or mean. SmartBoards are an excellent teacher-presentation tool, but I think they are most effectively used when students are allowed to interact with them as well. |
 |
The whole class uses TI graphing calculators to analyze a data set. We have a large-scale graphing calculator displayed on the SmartBoard so that everyone can follow along and learn which buttons to press. |
 |
During student-led conferences, sixth grade math students explained to their parents the work they are doing on the tablet computers. This student is showing his electronic portfolio and the work he did using DyKnow software. |
 |
DyKnow allows groups of students to collaborate electronically on math problems. These students are using DyKnow on the tablet computers to work on an equation together. |